
Cassini/RPWS/HFR-Kronos
Access to Lesia-Meudon data products
Southern and Northern SKR phase systems
SKR rotational modulation
The Saturn Kilometric Radiation (SKR) is an intense non-thermal radio emission produced in auroral regions by accelerated electrons moving along magnetic field lines, predominantly on the dawn sector (see e.g. the review of [1]). Its regular pulsation, whose origin remains unexplained yet, was originally interpreted as a clock-like rotational modulation triggered by the planetary magnetic field, and thus directly relating to the planetary interior.
SLS models
The Voyager determination of the SKR period (10h39min24±7s or 10.652±0.002h) [2] was adopted as the official rotation rate of the planet by the International Astronomical Union [3], and used to define the first Saturn Longitude System (or SLS 1). In this system, the SKR occurrence or intensity is organized by sub-solar longitudes and peaks at a fixed arbitrary value (historically set at 100°).
Ulysses observations later showed that the observed SKR period (~10.8h) is not constant but varies with time by 1% over years [4]. Further Cassini studies identified short-term 25 days oscillations of the southern SKR period [5] correlated to the fluctuations of the solar wind speed, together with long-term yearly oscillations that were also observed in magnetospheric plasma and magnetic field data and attributed to Enceladus mass-loading [6]. To account for long-term yearly variations of the SKR period, new longitude systems (SLS 2,3), based on polynomial fits of the SKR phase successively replaced SLS 1 [7,8]. SLS 2 and 3 were defined similarly to SLS 1, so that SKR maxima occur about sub-solar longitudes of 100°.
SKR northern/southern periods
The identification of a second SKR period (~10.6h) [8,9], unambiguously confirmed by different techniques [10,11], has strong implications on the validity of the longitude systems described above. Indeed, SKR periods at ~10.8h and ~10.6h were attributed to SKR emissions emanating from southern (S) and northern (N) hemispheres, and vary with time [9].
More recently, we have computed S,N SKR periods separately with a Lomb-Scargle analysis [12] (Figure 1), and associated phase systems (Figure 2), that organize S and N SKR maxima until 2010 (Figure 3). The description of the technique as well as obtained results are described in [13], and related publications are indicated here.
Data Access
This page provides an access to this dataset here, that includes time series of northern/southern SKR periods, phases and sub-solar longitudes between DOY 2004-001 and 2010-193.
Figures
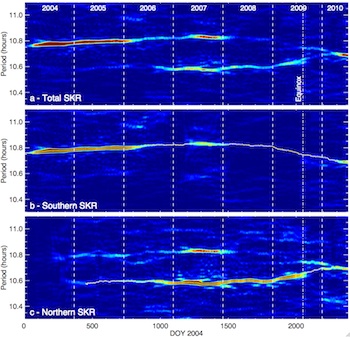
Fig. 1. Lomb-Scargle periodograms of (a) total, (b) southern and (c) northern SKR power radiated between 40 and 500 kHz as a function of period and time. Individual power spectra (columns, in arbitrary units) were computed over a 200-days long sliding window with a time step of 1 day. Solid yellow lines show S and N periods, as derived from panels (b) and (c).
[Large PNG](1.0MB) [High Res PDF](15.2MB)
[Large PNG](1.0MB) [High Res PDF](15.2MB)
](docs/skr-fig1.png)
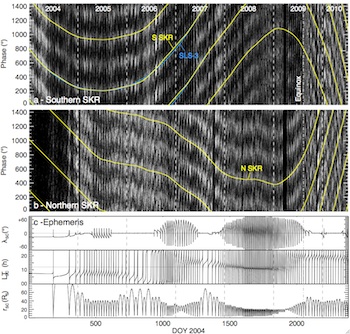
Fig. 2. [Open with acrobat reader for best resolution] (a) Plot of S SKR power normalized to the average over one rotation as a function of an arbitrary phase computed from a fixed reference period of 10.7928 h (enabling direct comparisons with [7,8]), between 2004-001 and 2010-193. Each rotation is replicated four times along the y axis for clarity. The S SKR rotational modulation (phase = 0°) is displayed in solid yellow, while the SLS-3 one (sub-solar longitude = 100°) is shown in solid light blue. Both correctly track S SKR maxima. (b) Identical plot for N SKR power and an arbitrary reference period of 10.6 h. (c) Cassini orbital parameters.
[Large PNG](791KB) [High Res PDF](44.5MB)
[Large PNG](791KB) [High Res PDF](44.5MB)
](docs/skr-fig2.png)
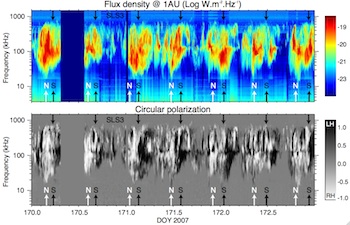
Fig. 3. Example of SKR dynamic spectra of flux (top) and circular polarization (bottom) for 2 days of near-equatorial observations in 2007. Emissions originating from both hemispheres are mixed. In the bottom panel, southern R-X mode SKR corresponds to V>0 (black) and northern R-X mode SKR to V<0 (white). Timings of SKR peaks are indicated by arrows. Top arrows correspond to SLS3 timings (sub-solar longitude = 100°), whereas bottom arrows correspond to Southern (black) and Northern (white) SKR peak timings (phase = 0°). As S and N SKR periods are different, SKR emission emanating from both hemispheres superimpose and may hide the modulation, when not in phase.
[Large PNG](614KB) [High Res PDF](19.2MB)
[Large PNG](614KB) [High Res PDF](19.2MB)
](docs/skr-fig3.png)
References
[1] Kurth et al., 2009. [link]
[2] Desch and Kaiser, 1981. [link]
[3] Seidelman et al, 2002. [link]
[4] Galopeau and Lecacheux, 2000. [link]
[5] Zarka et al, 2007. [link]
[6] Gurnett et al, 2007. [link]
[7] Kurth et al, GRL, 2007. [link]
[8] Kurth et al, JGR, 2008. [link]
[9] Gurnett et al, GRL, 2009. [link]
[10] Lecacheux, RPWS team meeting, 2009. [PDF] [PPT] (restricted access)
[11] Lamy, RPWS team meeting, 2009. [PDF]
[12] Lamy, PRE7, 2011. [PDF]