Sub arc sec evolution of solar magnetic fields
Th. Roudier, J.-M. Malherbe, J. Moity, S. Rondi, P. Mein, Ch. Coutard
Laboratoire d'Astrophysique de Toulouse - Tarbes (LATT)
et
Laboratoire d'Etudes Spatiales et d'Instrumentation en Astrophysique (LESIA)
The 43 mn sequence, time step 1 mn

MPEG movie (click to play)
Top: intensity at 144 mA of the core of the line
Top middle: magnetic field at 144 mA of the core of the line (single determination)
Bottom middle: radial velocity at 144 mA of the core of the line
Bottom: intensity continuum
Effect of destretching and summing magnetic fields

Time t=14 mn (click to enlarge)
Animated GIF image with blinking between a single magnetic field determination and the summ of 20 successive magnetic field determinations (within a few seconds) after destretching (the destretching procedure reduces the spatial resolution but increases the signal to noise ratio)

MPEG movie (click to play) of the 40 consecutive observations (within a few seconds) used for the 20 successive determinations of magnetic fields above at time t=14 mn (as a single determination requires the observations of 2 frames I+V and I-V)
Top: intensity at 144 mA of the core of the line
Bottom: intensity continuum
Time t=14 mn (click to enlarge)
Top: magnetic field at 288 mA of the core of the line (summ of 20 determinations after destretching)
Top middle: magnetic field at 144 mA of the core of the line (summ of 20 determinations after destretching)
Bottom middle: intensity continuum (with isocontours of magnetic fields at 144 mA of the core of the line)
Bottom: intensity at 144 mA of the core of the line (with isocontours of magnetic fields also at 144 mA)
The difference of altitude of the magnetic field at 144 mA (low chromosphere) and 288 mA (high photosphere) is about 160 km. We do not see in the quiet sun a significant difference of magnetic field strength between both levels, contrarily to our observation of 2003; as for velocities, they have generally different magnitudes at both altitudes.
Magnetic field gradient

Time t=14 mn (click to enlarge)
From top to bottom:
- gradient of the absolute value of the magnetic field (absolute value of the magnetic field at 144 mA minus absolute value of the magnetic field at 288 mA, see below). For 144 and 288 mA, the sum of 20 determinations of the magnetic field after destretching was used. In order to improve the signal to noise ratio, the spatial resolution was reduced to 1 arc sec by smoothing data before subtraction. Dark regions correspond to negative gradient (decreasing field strenght with height) while white regions correspond to positive gradient (increasing field strength with height)
- magnetic field at 288 mA of the core of the line (summ of 20 determinations after destretching)
- magnetic field at 144 mA of the core of the line (summ of 20 determinations after destretching)
- intensity at 144 mA of the core of the line with isocontours of magnetic field gradients: notice a negative gradient above the spot (-200 Gauss between both levels, the field strenght decreases with height). The gradient above the spot is about -0.5 to -1 Gauss/km, no significant gradient appears in quiet regions, and a small positive gradient occurs above filigree or bright points (white contours for negative gradient or field strength decreasing with height, black contours for positive gradient or field strength increasing with height)
- intensity at 144 mA of the core of the line with isocontours of magnetic fields
The difference of altitude of the magnetic field at 144 mA (low chromosphere) and 288 mA (high photosphere) is about 160 km.
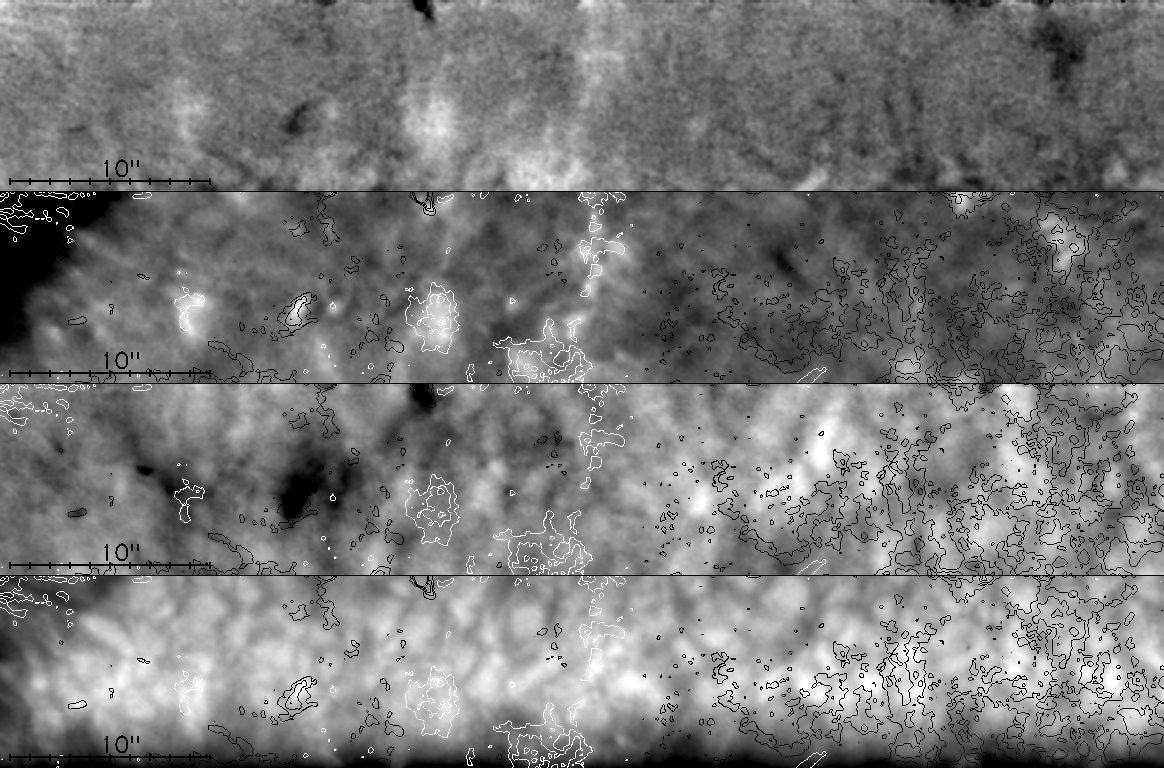
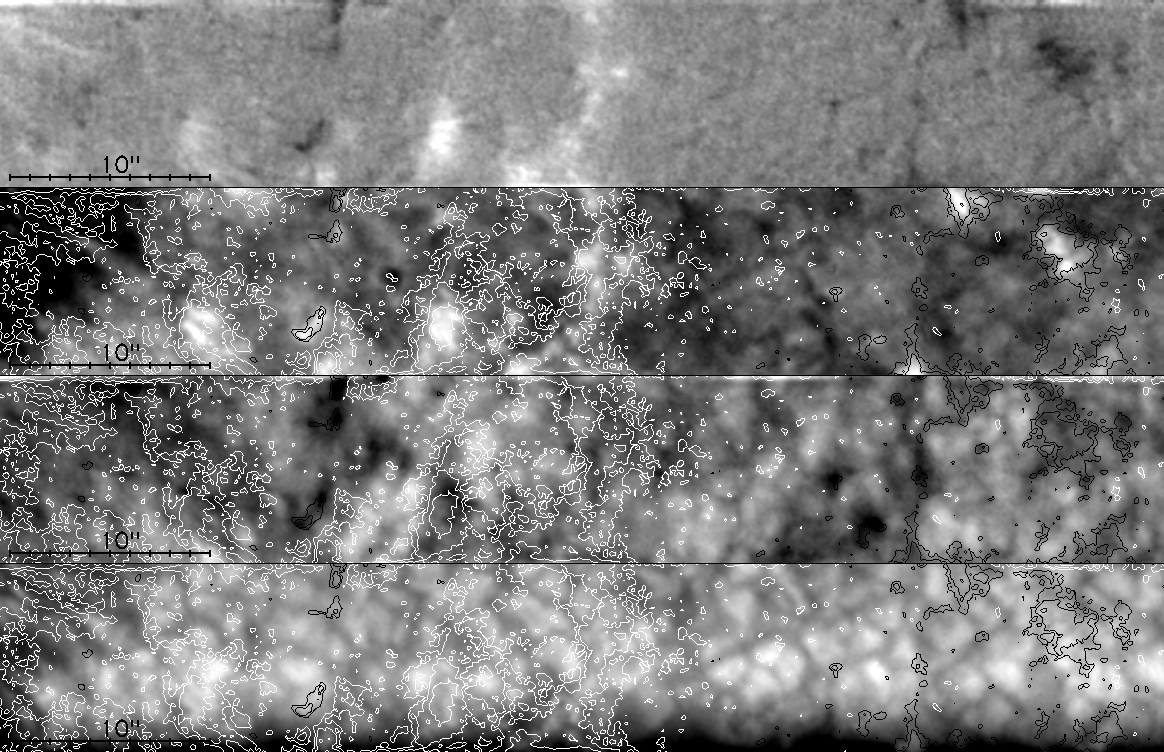
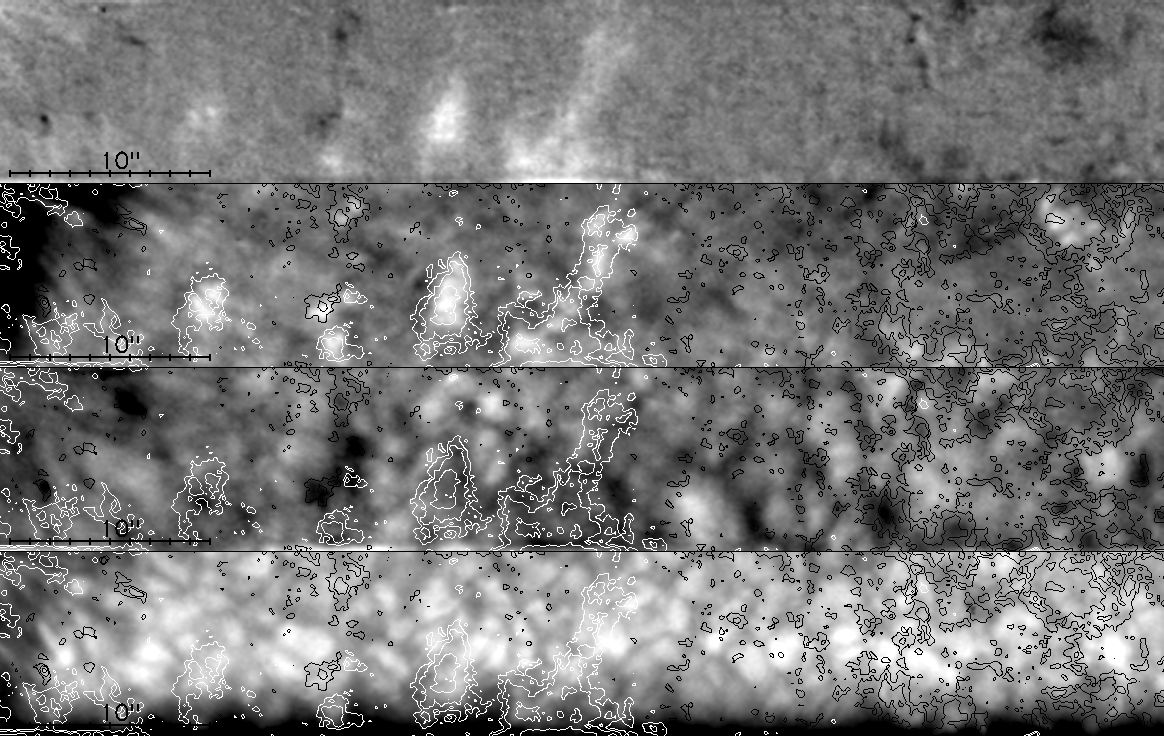
Three times extracted from the 43 mn sequence

Time t=12 mn (click to enlarge)

Time t=21 mn (click to enlarge)

Time t=31 mn (click to enlarge)
Top: magnetic field at 144 mA of the core of the line (single determination)
Top middle: intensity at 144 mA of the core of the line (with isocontours of magnetic fields)
Bottom middle: radial velocity at 144 mA of the core of the line (with isocontours of magnetic fields)
Bottom: intensity continuum (with isocontours of magnetic fields)
Please notice on the last time (t=31 mn) the nice correlation between intergranular lanes, downward velocities and magnetic concentrations in the granular field at right of the figure.