High resolution solar magnetometry with the spectrograph of the Pic du Midi Turret Dome
Malherbe, J.-M.; Roudier, Th.; Mein, P.; Moity, J.; Muller, R.
Laboratoire d'Astrophysique de Toulouse - Tarbes (LATT)
et
Laboratoire d'Etudes Spatiales et d'Instrumentation en Astrophysique (LESIA)
MSDP raw data
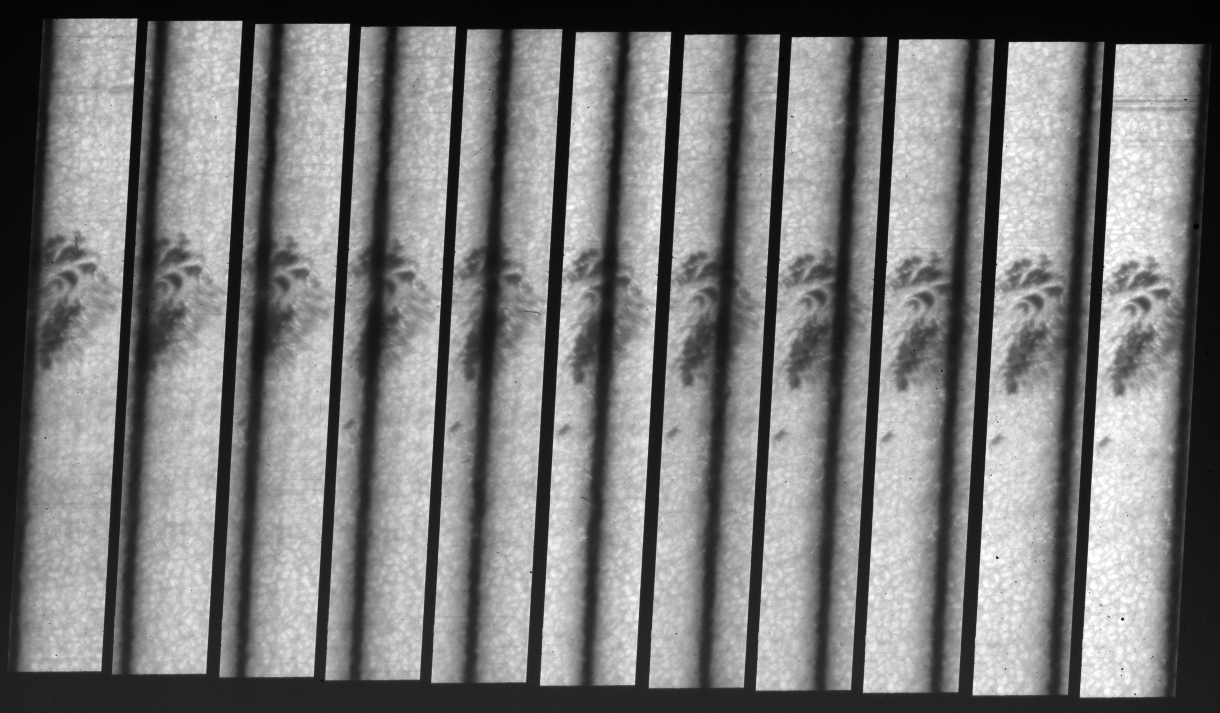
MSDP raw data in NaD1 line with 11 simultaneous channels (click to enlarge)
Animated GIF file: MSDP raw data in NaD1 line with alternate I+V
and I-V polarization states (click to enlarge)
MSDP data processing
Animated GIF file: raw continuum intensity in alternate I+V and I-V polarization states
Animated GIF file: continuum intensity in alternate I+V and I-V polarization states, AFTER DESTRETCHING
Animated GIF file: dopplershifts in alternate I+V and I-V polarization states, AFTER DESTRETCHING, at 144 mA of the line core. The doppler velocity and the magnetic field are respectively deduced from the sum and difference of these two quantities
Signal to noise ration
Animated GIF file: magnetic field deduced from a single pair I+V, I-V with/without destretching, and with destretching and summing of 10 couples I+V, I-V
Variation of magnetic fieds with depth
Animated GIF file: magnetic field deduced from a single pair I+V, I-V with destretching, at 144 mA (low chromosphere) and 288 mA (high photosphere) from the line core, altitude difference 160 km
Results
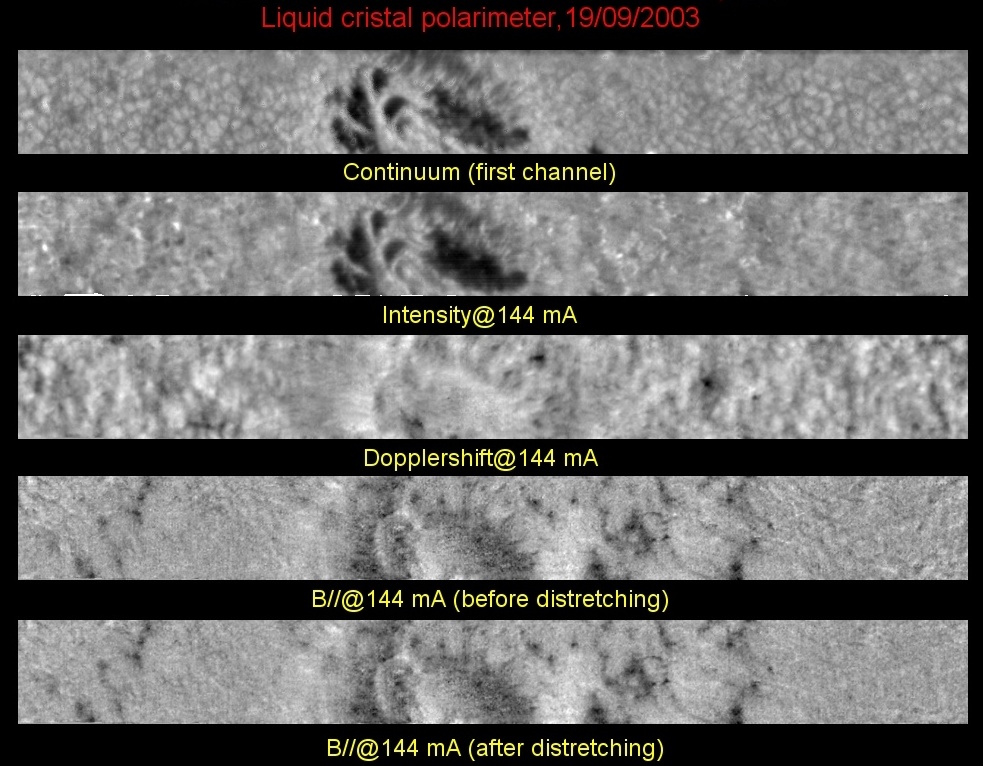
Top: continuum intensity
Top middle: intensity at 144 mA of the line core
Middle: velocity at 144 mA of the line core
Bottom middle: magnetic field at 144 mA of the line core before destretching
Bottom: magnetic field at 144 mA of the line core after destretching
(click to enlarge)
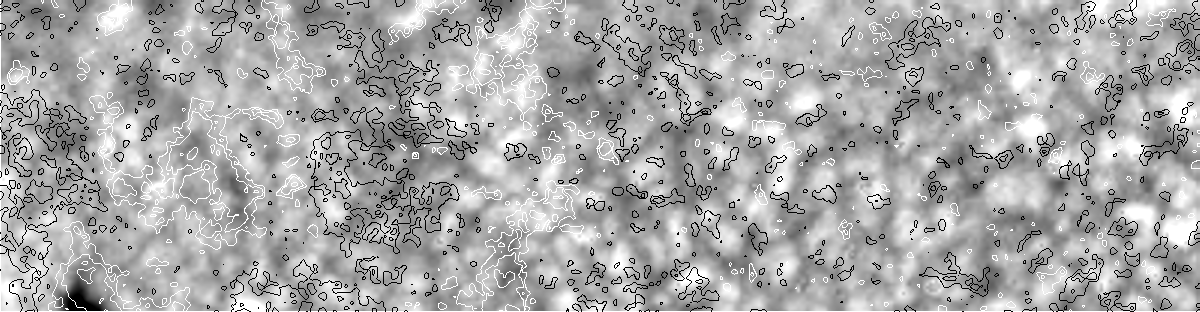
Continuum intensity and isocontours of the magnetic field at 144 mA of the line core (click to enlarge)