Link between surface Trees of Fragmenting Granules (TFG or families of granules) and deep downflows from MHD simulation - MPEG 4 Movies
Th. Roudier (IRAP), J.-M. Malherbe (LESIA), 2018
We find that TFG and horizontal surface flows (provided by the LCT) can be detected either from
intensities or Vz/Vdop component, for high resolution observations as well as numerical
simulations. We apply this method to a 3D run
providing the Vz component in depth. This reveals a close relationship between
surface TFG (the 5 Mm mesoscale) and vertical downflows 5 Mm below the surface.
We suggest that the dynamics of TFG form largers scales (the 15-20 Mm supergranulation)
associated to 15 Mm downflowing cells below the surface.
TFG and corresponding surface flows seem to be an essential key to understand
the formation and evolution of the network at the meso and supergranular scales.
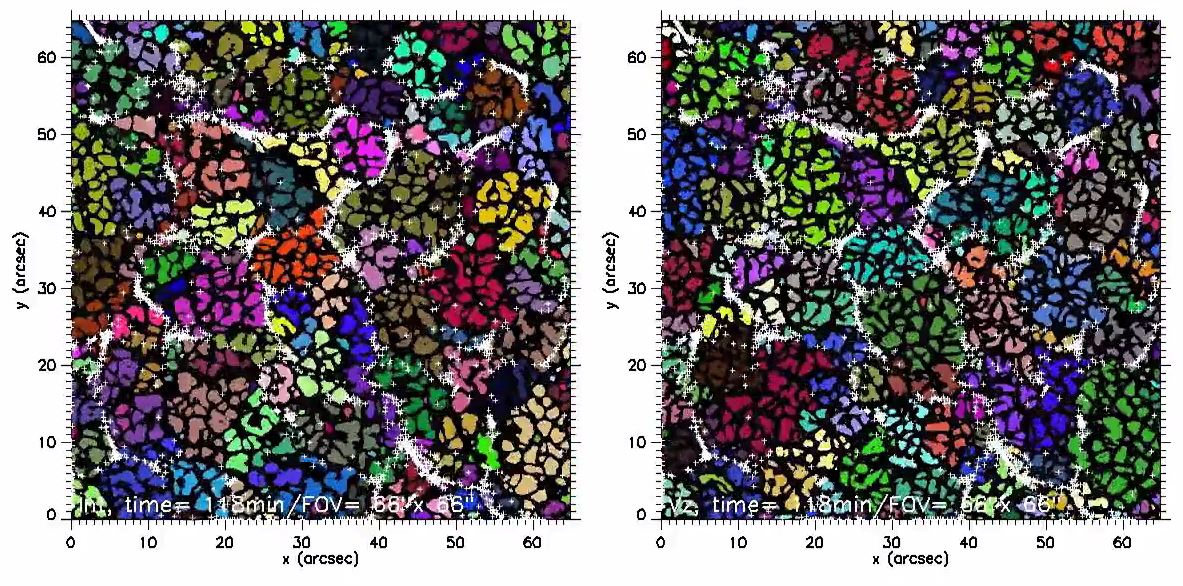
Movie 1 : TFG from segmentation/labelling and cork motions from Local Correlation Tracking (LCT)
both applied to intensity (left) or vertical velocity component (right), with
pixel size 0.13", FOV 65" x 65", time step 60 s and 24 hours simulation. TFG are displayed
in colours and white crosses correspond to corks moving at the local flow speed.
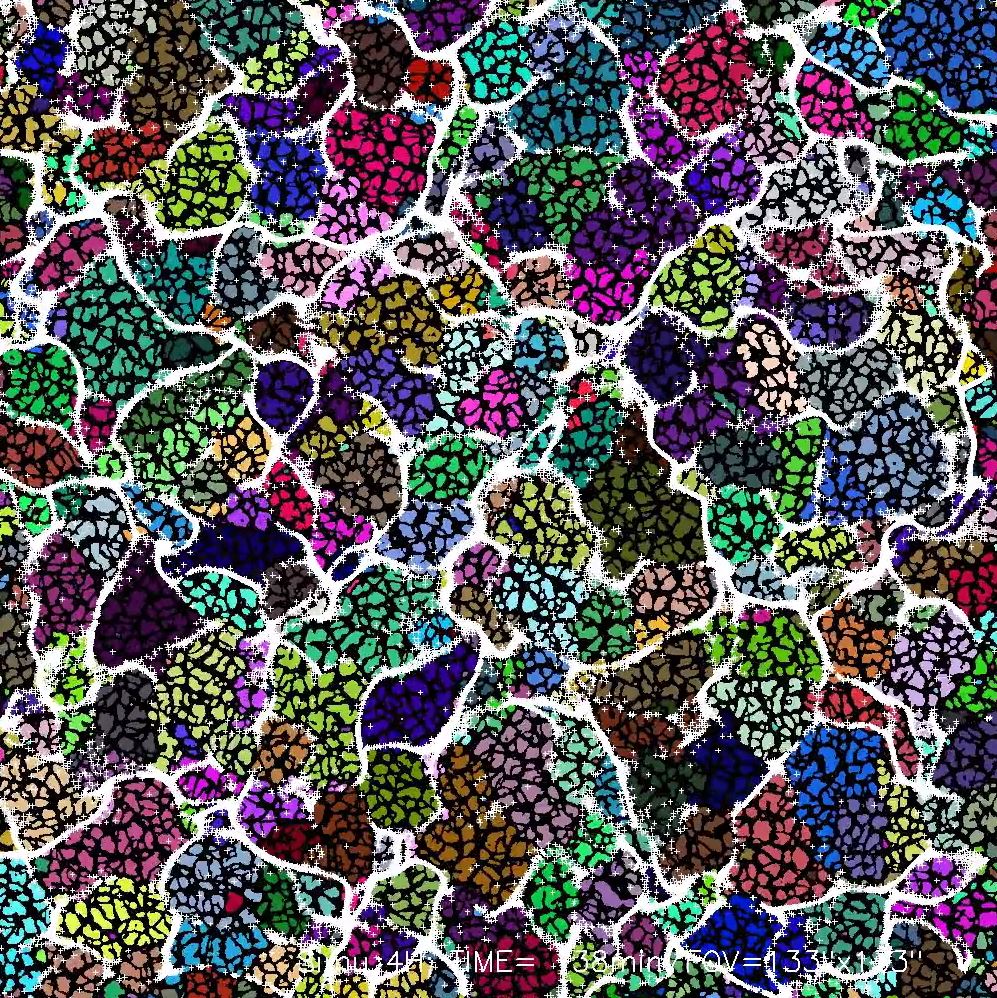
Movie 2 : TFG and free moving corks provided by the analysis of a 4 hours simulation,
pixel size 0.13", FOV 131" x 131", time step 60 s.
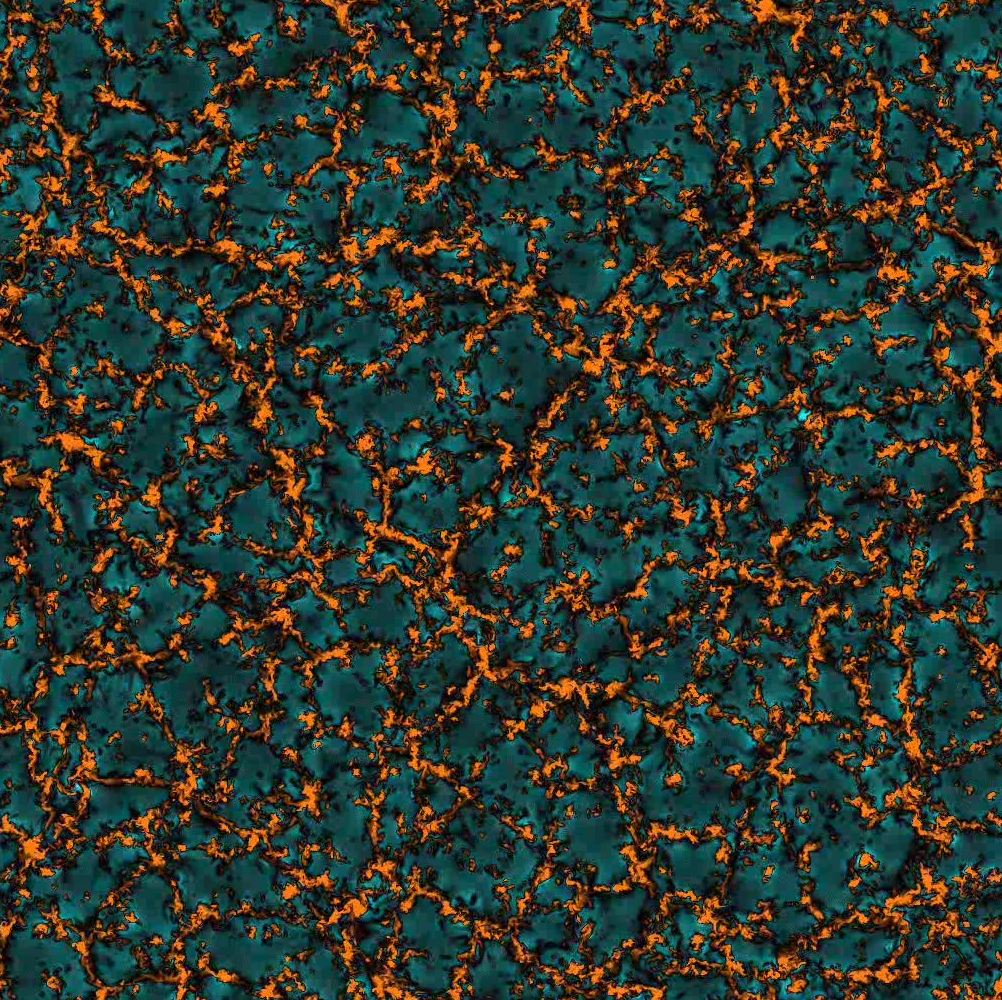
Movie 3 : Vertical velocity component (Vz) provided by the 4 hours simulation,
pixel size 0.13", FOV 131" x 131", time step 60 s. Upward/downward velocities
in blue/red. The movie explores Vz in depth from z = +0.5 Mm (above the surface) to z = -20 Mm
(below the surface). At z = 0 (surface), the granulation is visible with downflowing intergranules. At z = - 5 Mm,
the TFG or meso scale appears, while at z = -15 Mm, the supergranular
scale becomes visible.
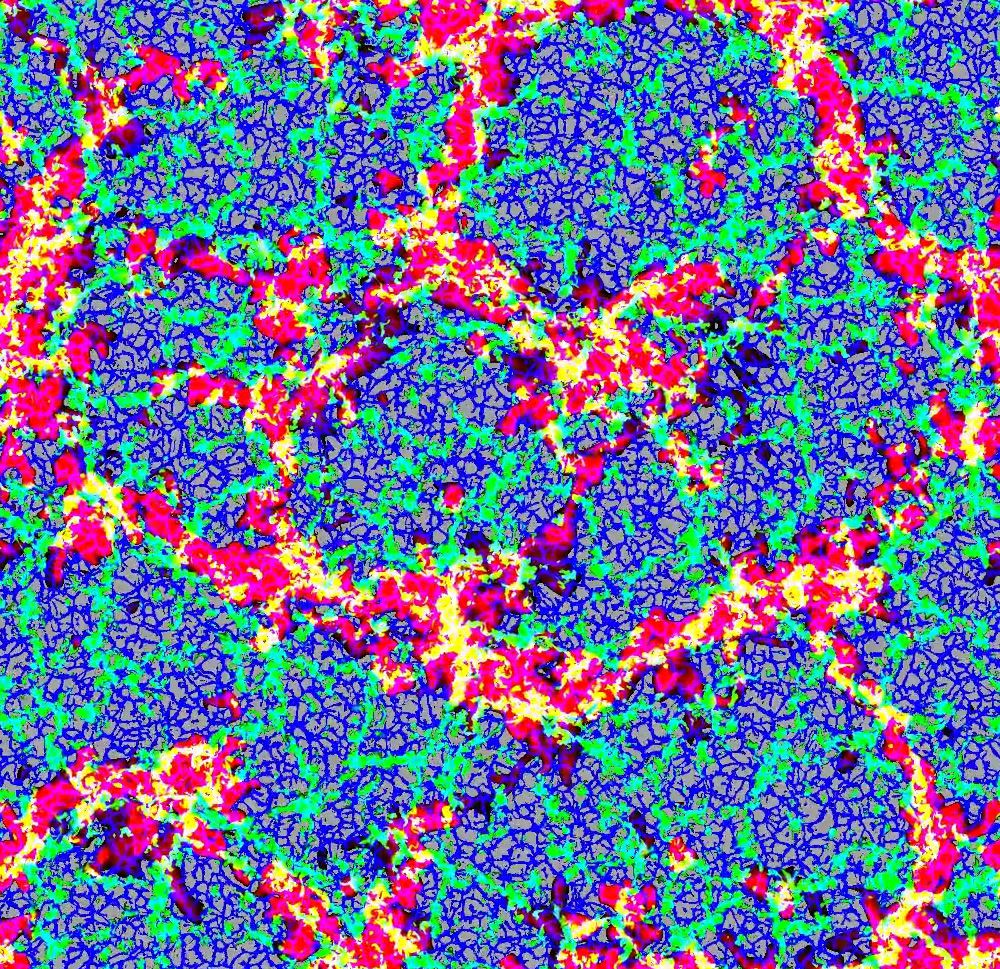
Movie 4 : Vertical velocity component (Vz) at 3 different depths provided by the the 4 hours simulation,
pixel size 0.13", FOV 131" x 131", time step 60 s. Blue: downflows at z = 0 (surface, short lived intergranules).
Green: downflows at z = - 5 Mm (medium lived TFG or meso scale). Red: downflows at z = -15 Mm
(long lived supergranular scale).
Movies 5, 6, 7, 8 : TFG (colour) revealed by segmentation/labelling of the vertical velocity
component (Vz) provided by the 4 hours simulation,
pixel size 0.13", FOV 131" x 131", time step 60 s. Downflows at 4 different depths are superimposed
in white: (a) z = -3 Mm; (b) z = - 5 Mm (TFG or meso scale); (c) z = - 8 Mm; (d) z = -15 Mm (supergranular scale)
(a) 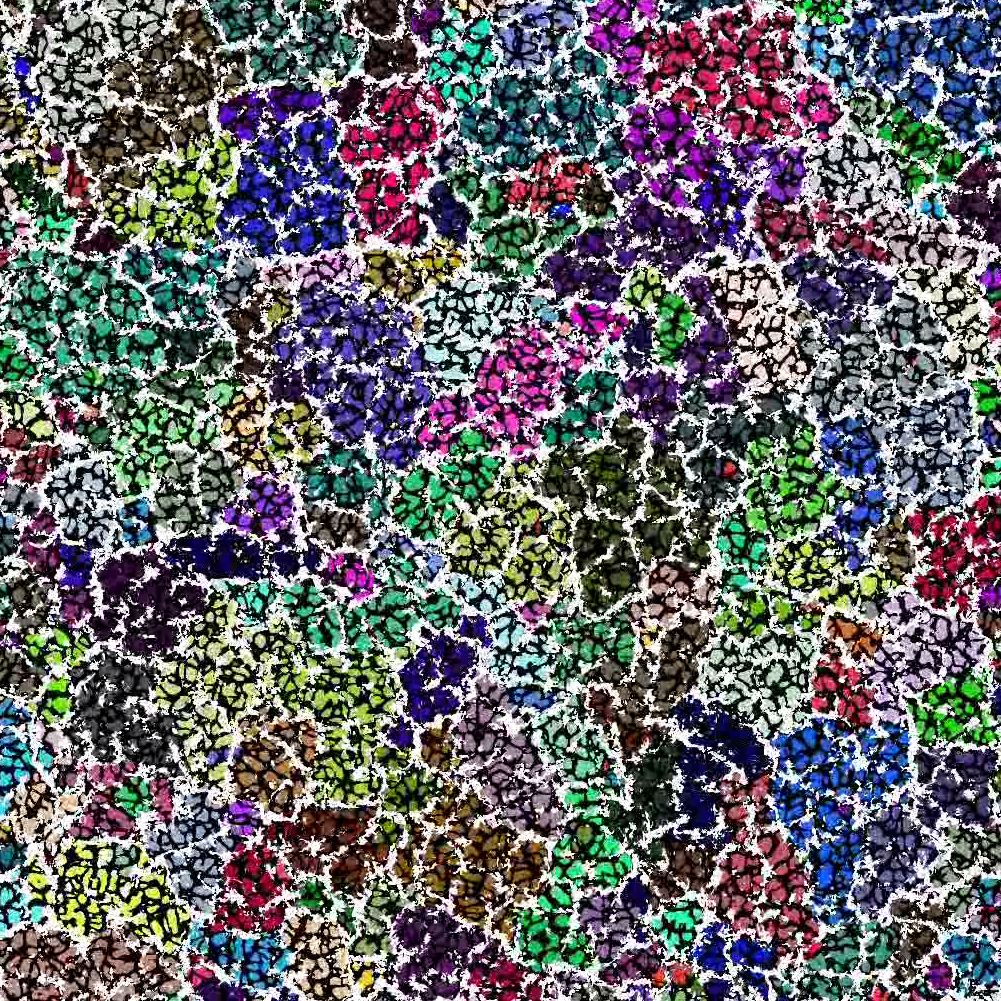 (b)
(b) 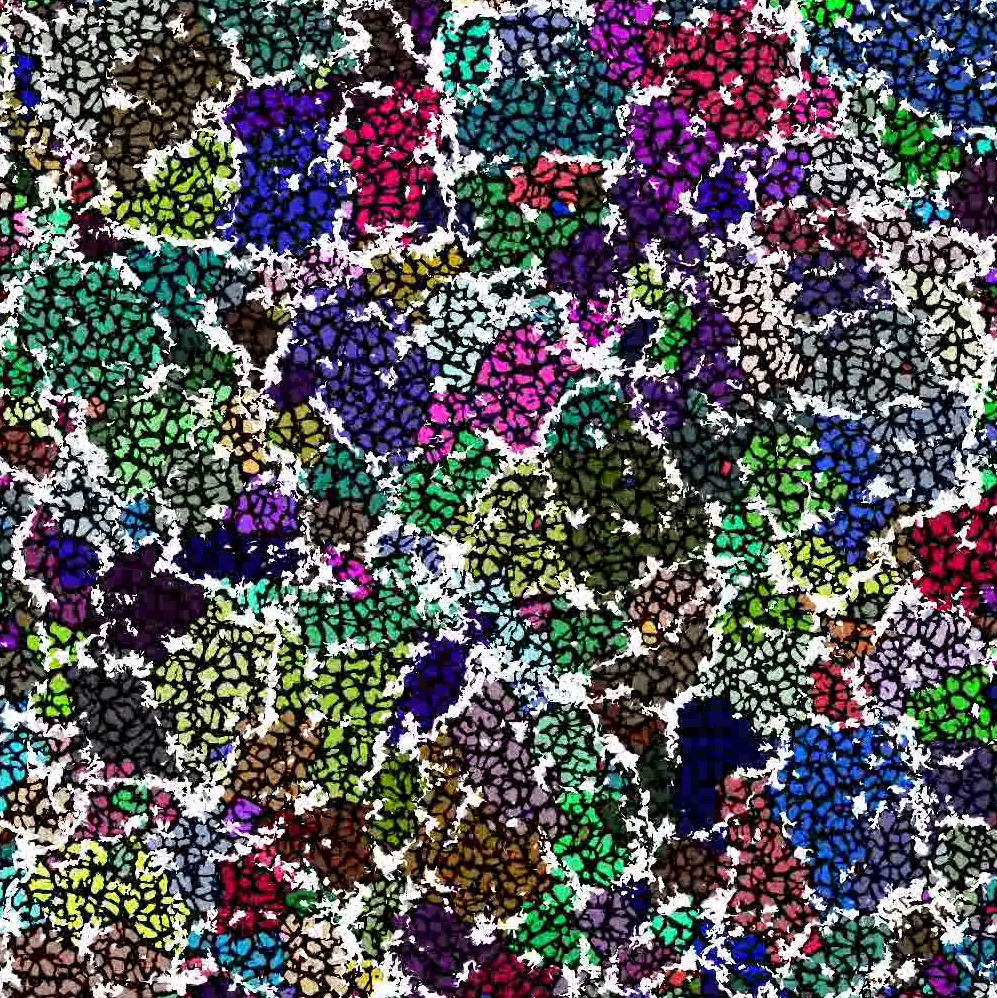
(c) 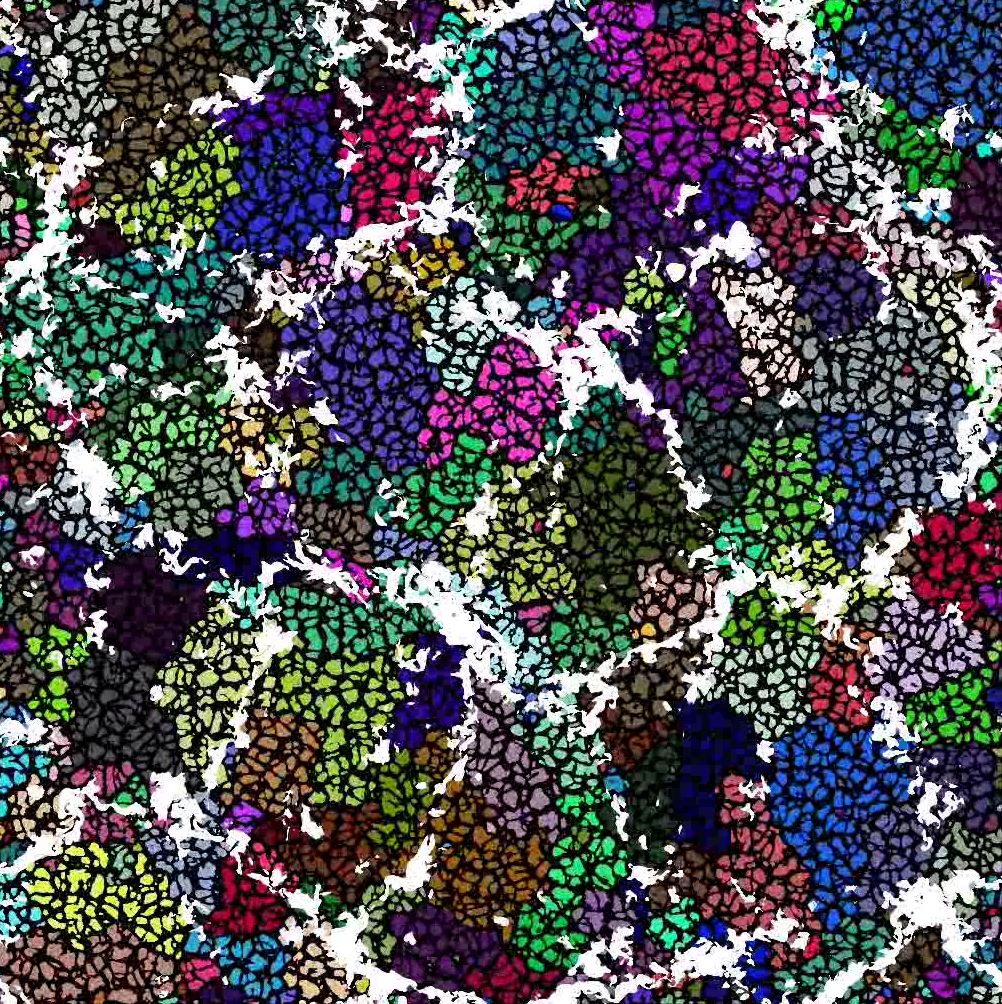 (d)
(d) 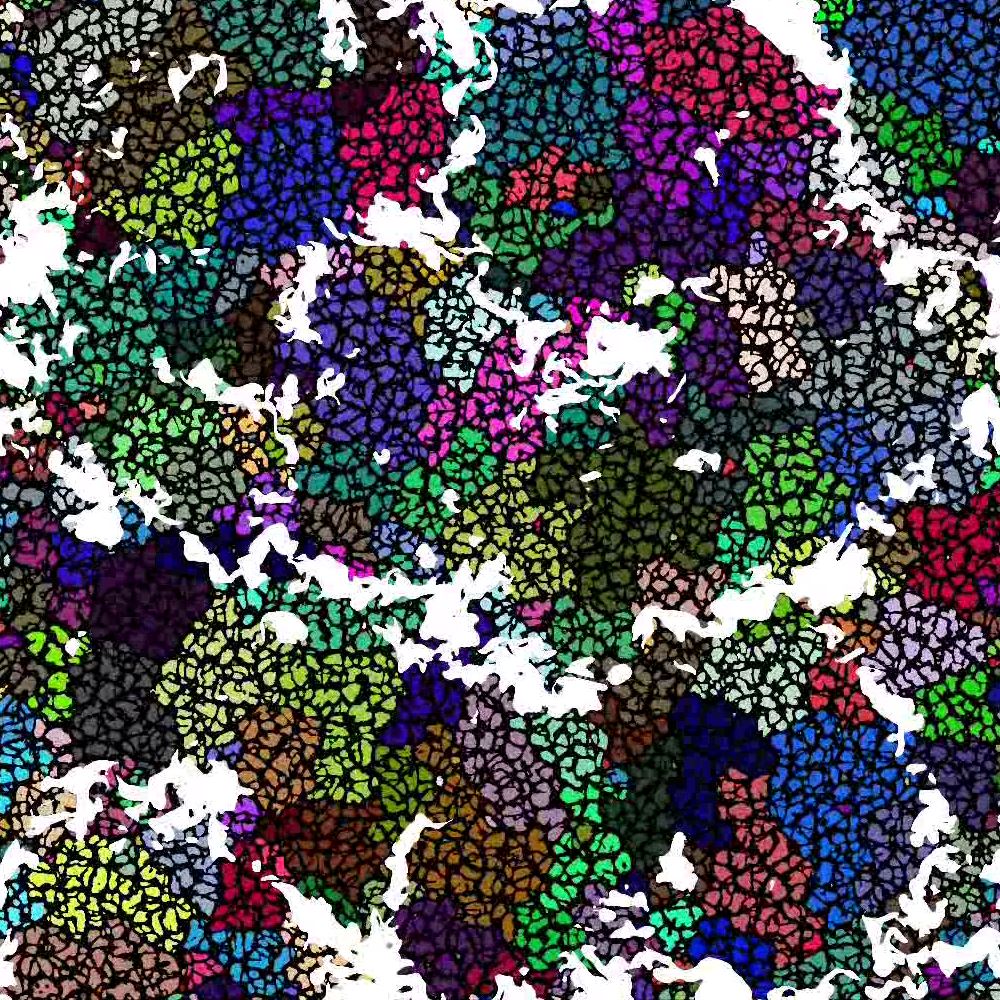
Movie 9 : Corks revealed by the LCT applied to the vertical velocity
component (Vz) provided by the the 4 hours simulation,
pixel size 0.13", FOV 131" x 131", time step 60 s. Blue/red: positive/negative divergence
of horizontal velocity (blue = diverging flow, red = converging flow). Green: downflow
below the surface at z = - 5 Mm. At the end, corks delineate the boundaries of TFG and the supergranular
scale (matching several TFG).
Horizontal flows are diverging inside TFG while converging at their boundaries.
Downflows at z = - 5 Mm are associated to the final location of corks at TFG or supergranule borders.
Density of corks is maximum in converging and downflowing locations, generally at the common border
of several TFG.
(a) individual corks (white crosses)
(b) surfacic density of corks (the size of white bowls is proportionnal to the density)
(a) 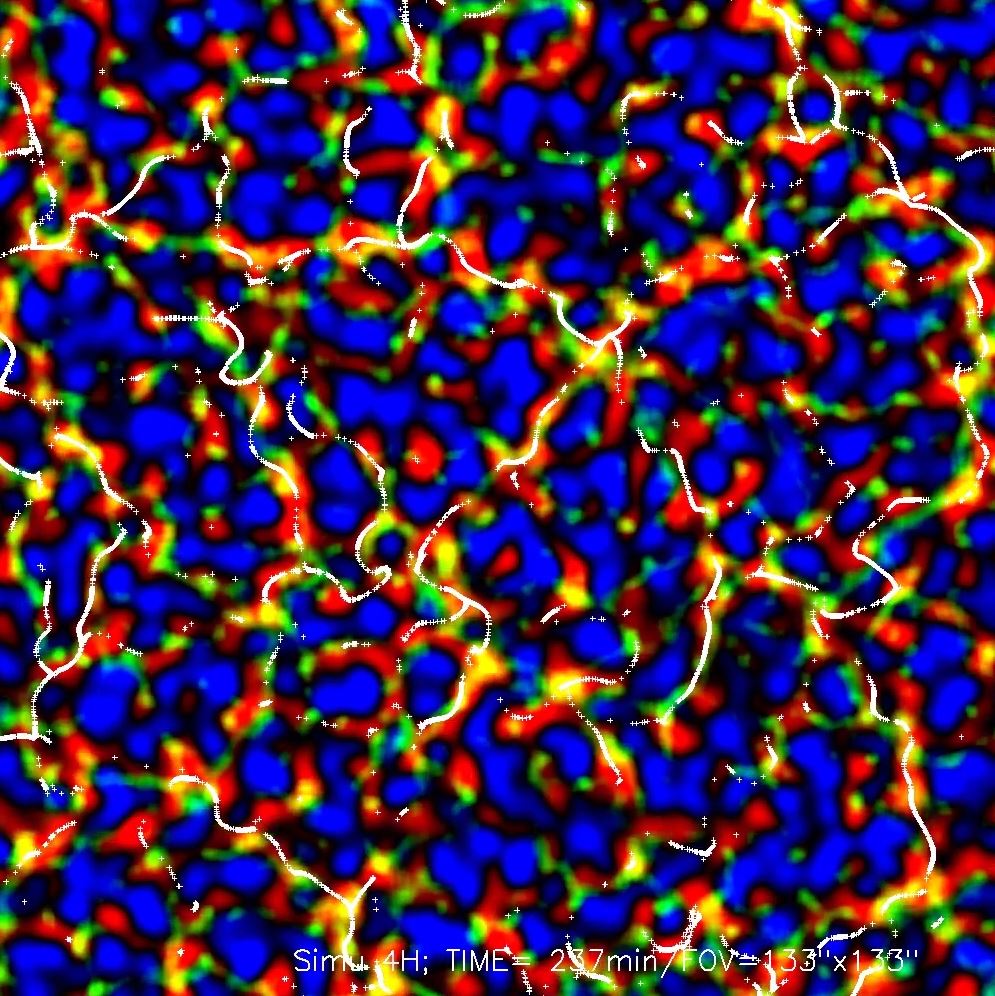 (b)
(b) 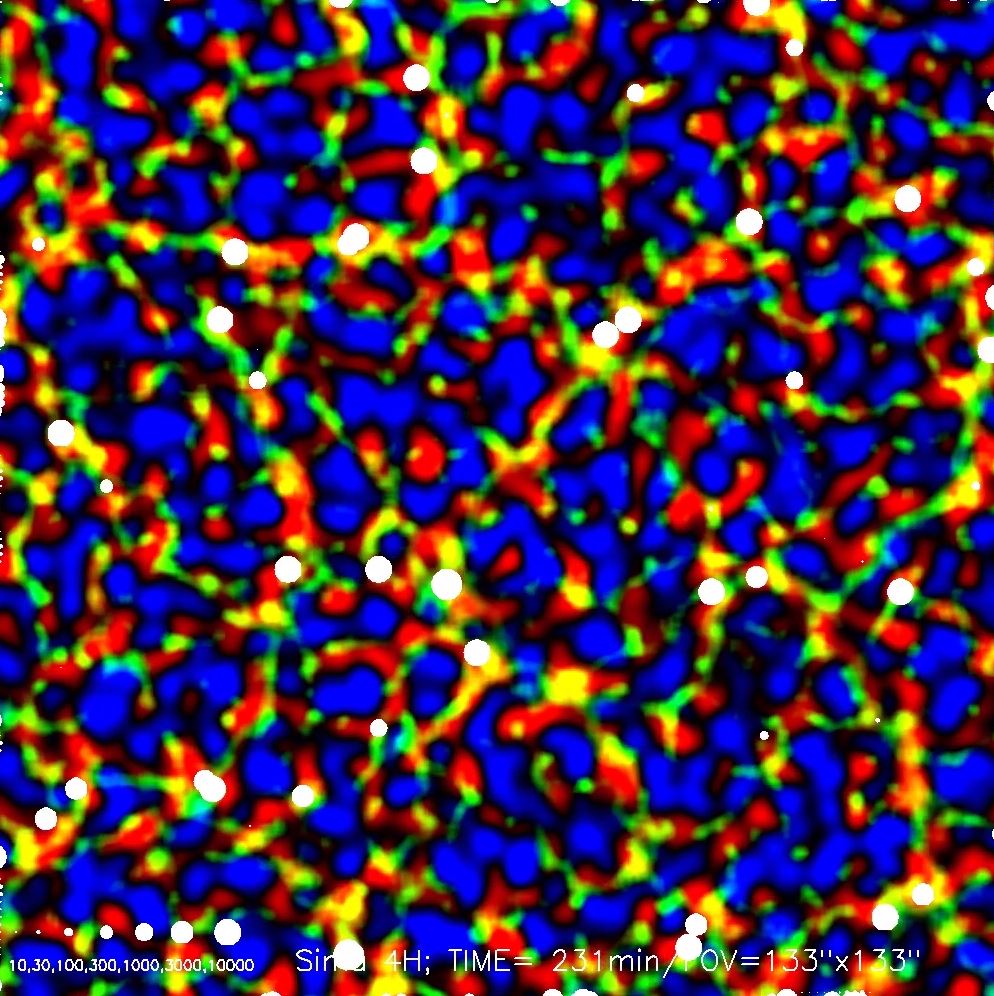
2018, Roudier Th. (IRAP), Malherbe, J.-M. (LESIA)
Movie 1 : TFG from segmentation/labelling and cork motions from Local Correlation Tracking (LCT) both applied to intensity (left) or vertical velocity component (right), with pixel size 0.13", FOV 65" x 65", time step 60 s and 24 hours simulation. TFG are displayed in colours and white crosses correspond to corks moving at the local flow speed.
Movie 2 : TFG and free moving corks provided by the analysis of a 4 hours simulation, pixel size 0.13", FOV 131" x 131", time step 60 s.
Movie 3 : Vertical velocity component (Vz) provided by the 4 hours simulation, pixel size 0.13", FOV 131" x 131", time step 60 s. Upward/downward velocities in blue/red. The movie explores Vz in depth from z = +0.5 Mm (above the surface) to z = -20 Mm (below the surface). At z = 0 (surface), the granulation is visible with downflowing intergranules. At z = - 5 Mm, the TFG or meso scale appears, while at z = -15 Mm, the supergranular scale becomes visible.
Movie 4 : Vertical velocity component (Vz) at 3 different depths provided by the the 4 hours simulation, pixel size 0.13", FOV 131" x 131", time step 60 s. Blue: downflows at z = 0 (surface, short lived intergranules). Green: downflows at z = - 5 Mm (medium lived TFG or meso scale). Red: downflows at z = -15 Mm (long lived supergranular scale).
Movies 5, 6, 7, 8 : TFG (colour) revealed by segmentation/labelling of the vertical velocity component (Vz) provided by the 4 hours simulation, pixel size 0.13", FOV 131" x 131", time step 60 s. Downflows at 4 different depths are superimposed in white: (a) z = -3 Mm; (b) z = - 5 Mm (TFG or meso scale); (c) z = - 8 Mm; (d) z = -15 Mm (supergranular scale)
(a)
(b)
(c)
(d)
Movie 9 : Corks revealed by the LCT applied to the vertical velocity component (Vz) provided by the the 4 hours simulation, pixel size 0.13", FOV 131" x 131", time step 60 s. Blue/red: positive/negative divergence of horizontal velocity (blue = diverging flow, red = converging flow). Green: downflow below the surface at z = - 5 Mm. At the end, corks delineate the boundaries of TFG and the supergranular scale (matching several TFG). Horizontal flows are diverging inside TFG while converging at their boundaries. Downflows at z = - 5 Mm are associated to the final location of corks at TFG or supergranule borders. Density of corks is maximum in converging and downflowing locations, generally at the common border of several TFG.
(a) individual corks (white crosses)
(b) surfacic density of corks (the size of white bowls is proportionnal to the density)
(a)
(b)
2018, Roudier Th. (IRAP), Malherbe, J.-M. (LESIA)